Classification with machine learning: that was the title of one of the last projects I have done via Upwork. In this post I will tell what the project was about and what I have done.
Click–through rate (CTR) is the ratio of users who click on a specific link to the number of total users who view the page that contains the link. For a marketing company, a high CTR normally means an effective campaign, since many people click on the link ans thus visit the website of customer X. This project involved predicting the probability if a user would click on a given advertisement or not.
There were some requirements from the technical side: python in combination with jupyter notebook. For the machine learning part, there were 2 options. The first being sklearn, the second (preferred) being Spark ML. Furthermore a stacking of Gradient Boosted Trees (GBT) with Logistic Regression (LR) had to be used in combination with GridSearchCV to find the hyperparameters, a modelling approach that was effective for Facebook. A quite challenging job from this perspective, since I haven’t been using stacking of algorithms that much.
Data / Modelling
The client provided about 2 GB of data about historical campaigns. This included features like country, browser, campaign-id and also if a user had clicked on the link or not. So, a supervised machine learning challenge since the result feature (clicked or not) is in the dataset.
I have first build the model in sklearn. There were some challenges here, because the data was very unbalanced (a lot more data for users that did not click). One challenge with such a dataset is that you have to choose a right metric to optimize for. Let’s say you would have a dataset in which 1% of the entries has a positive result and 99% a negative result. A simple model that is always predicting a negative result, would be right in 99% of the cases, not bad! In this situation, the accuracy which is defined by the number of right predictions divided by the total number of predictions, would not be a good choice. It would be better to use either precision or recall
In the FB paper, the metric Normalized Entrophy (NE) is used. It is defined by the average log loss per impression divided by what the average log loss per impression would be if a model predicted the background click through rate (CTR) for every impression. The lower this score, the better the predictions are that the model has created. One other thing to be careful about is that GridSearchCV in sklearn always tries to maximize the given metric, so for a metric like NE, the negative score should be provided, to obtain the best result!
Comparison of Models
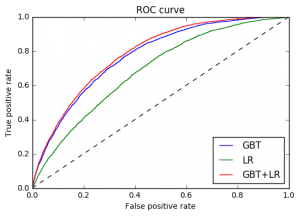
I have compared LR with GBT and the stacked solution of GBT+LR. The stacked solution proved to be just a little better than GBT on itself. Below the ROC curves for those models.
After the model was finalized, I have been looking into Apache Spark and how to tweak the performance. In my next article I will tell something about that.
