This week, the European R Users Meeting (eRum) is happening. It’s a biennial conference that brings the R User Community together and this year it would be held in Milan. Because of covid-19, the organizers decided to do the whole conference online. I am very happy that the conference didn’t have to be cancelled, though it’s too bad we can’t visit Milan. Furthermore I am excited that I will give a lightning talk about “Reproducible Data Visualization with CanvasXpress”!
Since I am working with CanvasXpress since a couple of years, I know it quite well. I wrote about it before in this blog. Many times I have been surprised by the amount of functionality that the library provides. Especially all the options that are available after the chart has been created. There’s a ‘Reproducible Research’ sub-menu which has been extended lately with a very cool replay option.
Replay
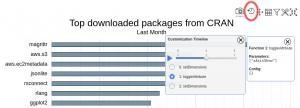
When you make changes to a rendered plot, canvasXpress keeps a history of these changes. You can reset the chart back to it’s original state and replay the previous changes that you have made using the replay button. This button is the 2nd leftmost button in the top menu bar, see the screenshot below. It’s only available if you have made any changes to the plot.
The replay creates a new window that displays all the user actions step by step. For each step, more information is available when selecting that step. In the example above, I have removed the x-axis on top in step 1. This relates to the property ‘xAxisShow’.
What if you would like to share this replay with your coworker? Well, you can download the chart in PNG format using the camera icon in the top menu. The downloaded image also contains the user actions. So if your coworker is importing your canvasXpress PNG, he/she can do the same replay as you. Pretty nice huh?
I will give a demonstration about the replay functionality in my presentation this Friday. Please have a look at the eRum schedule for the exact time and (online) location.
