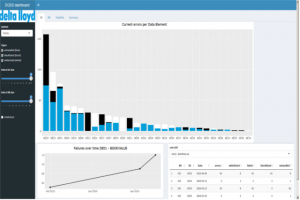
I have worked for a while at Delta Lloyd in the Data Quality team where I was responsible for the data engineering and data analysis part. I consisted of developing an ETL pipeline and performing analysis of the business data. To quickly get insights about the data quality, I have developed an interactive dashboard and a user interface to kickstart the ETL pipeline. Because I have used R in this project, the user interfaces have been developed in Shiny (the web application framework from R). I have received a lot of positive feedback on the interactive dashboards because it is faster, more flexible and better accessible than Excel sheets what people still tend to use a lot.
Because I can’t share company data, there is no live link but only a screenshot.
