Mission
Turning your data into insights
My name is Ger Inberg, a Dutch data developer with a background in software engineering.
I work remotely as a freelance data scientist. Getting insights out of data is something that I really like. Data visualization and machine learning are some techniques that I am using to achieve this.
I am a big open source believer since I think with sharing solutions we can achieve a lot more as a community. Therefore I prefer to use R and python for my daily work.
I have a passion for (endurance) sports and healthy living and I would love to help you out if you have a project in those areas!
On my website you can find some examples of my projects, most of them are links to a website or interactive visualization.
Have fun in browsing through the content and thank you for visiting!
Blog
FeatureExtraction on CRAN
Feature engineering is a crucial step in the data science process, often making the difference between a good model and a great one. It involves transforming raw data into meaningful features that can improve the performance of predictive models. For those working in R, the […]
DrugExposure Diagnostics
DrugExposureDiagnostics: A Comprehensive R Package for Assessing Drug Exposure in Clinical Research Drug exposure is an essential aspect of clinical research, as it directly affects the efficacy and safety of drugs. Measuring drug exposure accurately and understanding the factors that influence it is crucial for […]
Multi page shiny apps
Web applications can have rich functionality nowadays. For example a website of an E-commerce shop has a page about the products they are selling, a page about their conditions, a shopping cart page and an order page. Furthermore it can handle different HTTP requests from […]
Portfolio


Services
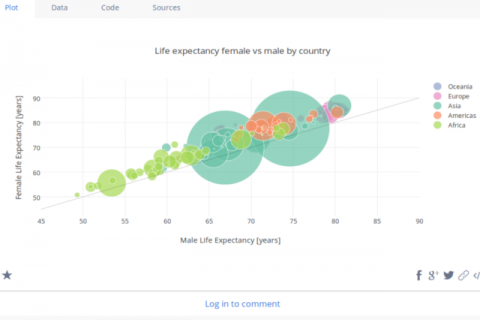
Data visualization
A picture says more than a thousand words..but what exactly do you want to visualize?
I have seen a lot of examples of very good but also very bad visualizations. For example a pie chart with more than 3 or 4 categories is not readable in my opinion. Because people are better at comparing lengths than areas, a bar chart is a better choice in many cases. I am using rainbow colors only occasionally since there is no “greater than” ordering in colors so it’s hard for a human to compare quantitative data. Until now I have used R/shiny, D3js, plotly, QlikView and Tableau for my data visualizations with most experience in the first 2.
Machine learning
Need to make predictions based on historical data? Or want to explore your data for certain patterns?
Machine learning is a discipline that can be applied to a lot of domains. IBM Watson changes the world of healthcare by applying machine learning. Many companies are working on self driving cars, which are all based on some sort of machine learning.
I have experience with supervised, unsupervised and reinforcement learning. In recent projects I have for example predicted nitrate level from image analysis and I have build a fraud detection algorithm based upon historical transactions.
Remote training
Are you interested in visualizing your data yourself? Do you want to start with R programming?
I offer remote training for a variety of topics related to R. In only a half day, you can be up and running with R and start with analyzing your data.
Topics for beginners include: introduction to R/RStudio, Git, RMarkdown, and Shiny. Please contact me in case of specific training needs.